

Shim ReStackor
ReStackor pro

ReStackor pro Shock Damping Coefficient Calculations
The input file for the XR650 ReStackor calculations was setup here. This exercise runs the stock valve stack at a couple of different clicker settings to create a damping force vs clicker setting map and a map of the damping coefficient. The first calculation is with the clickers "centered" at the 11 click position. The clicker position is entered in Cell h10.
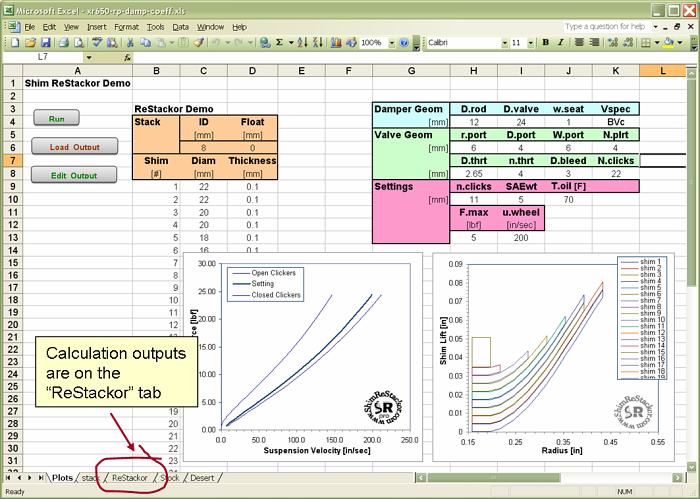
After clicking on the run button and the Load_Output button the ReStackor calculation results are loaded into the "ReStackor" tab of the spreadsheet. All of the plots in the ReStackor spreadsheet are automatically updated when a new output file is loaded.
![]()
ReStackor Output
The ReStackor pro outputs are loaded into the "ReStackor" tab when you hit the "Load_Output" button.
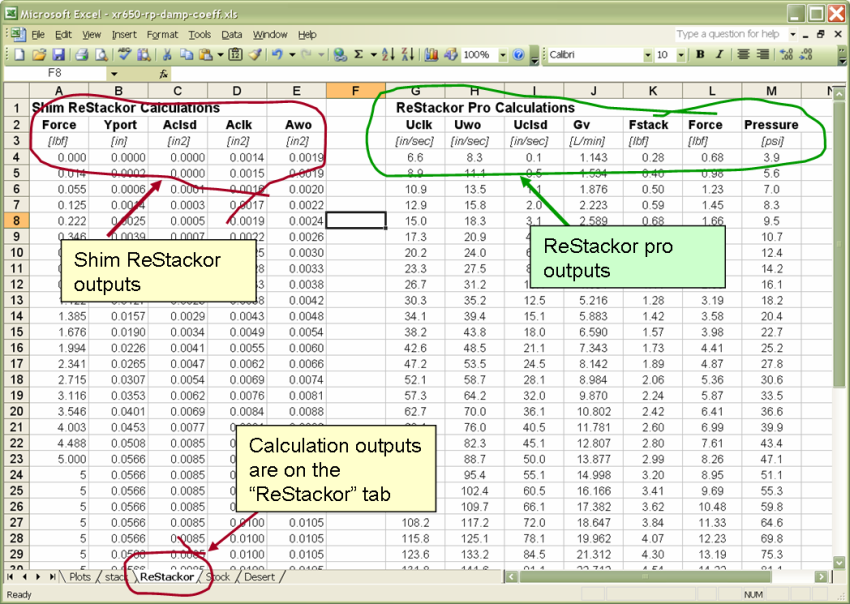
Results from Shim ReStackor calculations are in columns A through E and the ReStackor pro outputs are in columns G through M. The values in the output field are:
-
Shim ReStackor Output
-
Force (column A): Force applied to the shim stack
-
Yedge (column B): Edge lift height of the shim stack
-
Aclsd (column C): Valve flow area with the clickers closed
-
Aclk (column D): Valve flow area at the clicker position specified in the input file
-
Awo (column E): Valve flow area with the clickers wide open
-
ReStackor pro Output
-
Uwheel (column G): Suspension velocity with clickers at the set point defined in the input file
-
Uwo (column H): Suspension velocity with clickers in the wide open position
-
Uclsd (column I): Suspension velocity with the clickers in the closed position
-
Gv (column J): Oil flow rate through valve in Liters/min
-
Fstack (column K): Force applied to shim stack by fluid flow
-
Force (column L): Damping force produced by shock
-
Pressure (column M): Pressure difference between valve face and fluid reservoir
![]()
Generating a Clicker Map
We want to run a couple of cases with different clicker settings to make a map of damping force -vs- clicker settings. Every time you click on the Load_Output button the data in the "ReStackor" output tab are overwritten by the current output file. To save the data between calculations we need to copy the data to a different worksheet so they aren't overwritten.
A new worksheet named "stock" was created and the ReStackor outputs in columns G through M copied to it. A second calculation was run with the clickers set at 6 clicks and the results pasted into the "stock" sheet in columns L and M. Only the wheel velocity and damping force data were copied from the ReStackor worksheet for the 6 click case since that is all we need for this plot. With these results a clicker map was plotted as shown in the worksheet below.
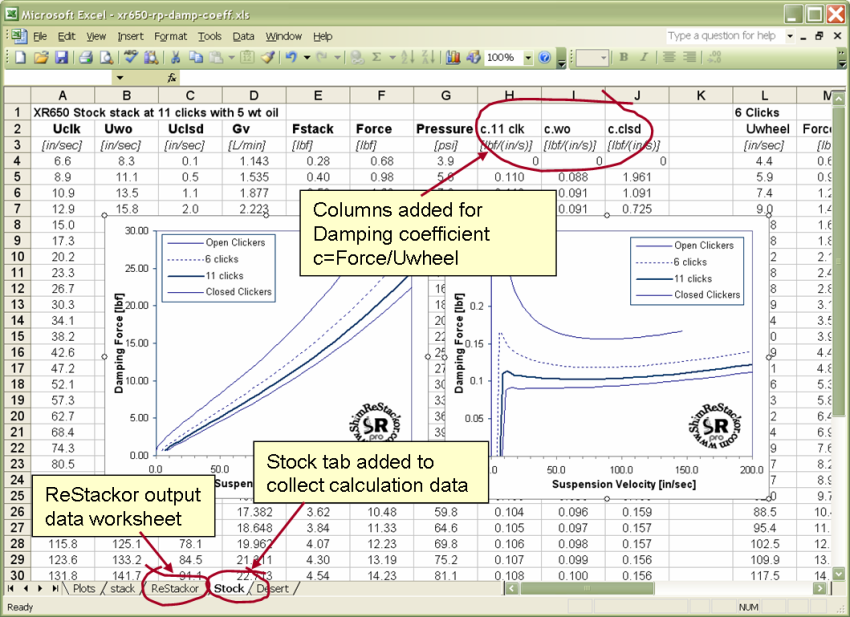
To construct the damping coefficient plot we need to compute the damping coefficient. This is simply the damping force produced by the shock absorber divided by the suspension velocity. To create the damping coefficient columns H through J were added to the spreadsheet. Column H contains the damping coefficient with the clickers at the 11 click position. The value in column H is the damping force in column F divided by the wheel velocity at the 11 click position which is in column A. Similarly the damping force with the clickers wide open (column I) is the damping force in column F divided by the wheel velocity in column B.
After computing the damping coefficient in columns H through J and column N the damping coefficient can be plotted.
The instructions here assume you are familiar with excel and how to run and manipulate data within spreadsheets. We are not going to go into how to create a plot in excel. If you need help with that check out the microsoft excel website.
RETURN to XR650 sample case.
