

Sample Applications

Mid-Valve Cavitation
ReStackor pro Fluid Dynamics
-
When a bike is under hard acceleration,
 or on a hill climb, it is desirable to have near zero spring force at the
top of the stroke to allow the fork to float over small bumps.
or on a hill climb, it is desirable to have near zero spring force at the
top of the stroke to allow the fork to float over small bumps. -
Cavitation suppression requires heavy pressurization of the shock fluid reservoir to backpressure the fluid circuits and keep the shock from cavitating.
ICS systems attempt to fulfill these two conflicting requirements. Float on the ICS spring keeps the spring forces low at the top of the stroke but leave the reservoir un-pressurized. As the suspension is driven deeper into the stroke engagement of the ICS spring pressurizes the reservoir and the fluid circuits of the shock. The compromise in reservoir pressurization required to satisfy these two conflicting requirements result in unusual suspension behaviors that are often difficult to diagnose.
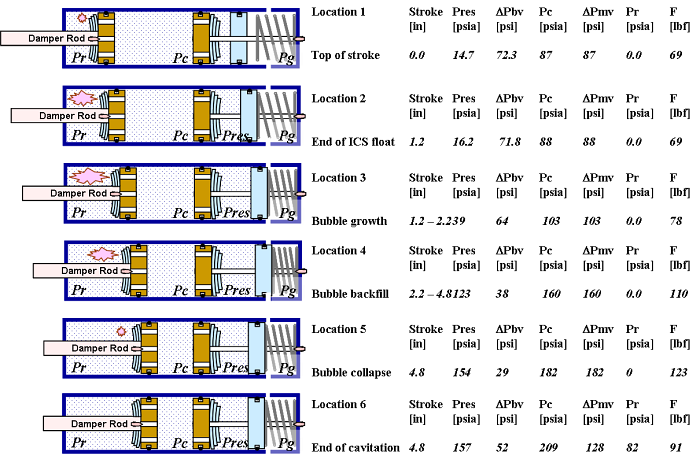
The series of figures below identify six positions over the coarse of a suspension stroke where cavitation influences the behavior of a shock. Each of these points are reviewed below along with ReStackor plots quantifying the effect of each event on the damping performance of the shock.
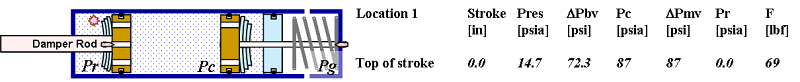
Damping performance of an ICS chambered fork is effected by cavitation initiated by the un-pressurized reservoir at the top of the stroke.
![]()
The Cause of Cavitation
Shim stacks on an MX mid-valve suspension setup are typically much softer than the base valve. While softer, higher mid-valve oil flow rates result in a rapid increase in pressure drop as suspension speeds increase.
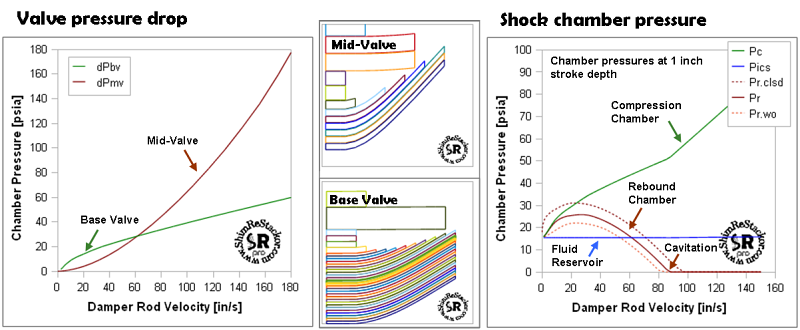
Rapid increase in mid-valve pressure drop causes cavitation at high suspension velocities.
The suspension velocity where cavitation initiates depends on the mid-valve stack float, base valve stiffness, clicker positions and stiffness of the ICS spring. These systems are all modeled in ReStackor calculations allowing you to experiment with each setting and determine the effect of those settings on cavitation initiation, cavitation recovery and the effect of cavitation on overall suspension performance.
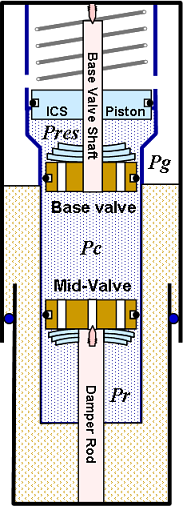
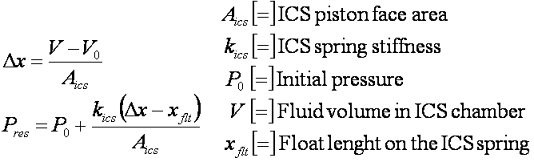
The pressure produced by an ICS system is controlled by the spring stiffness and travel of the ICS piston. The piston travel is a simple function of the volume of fluid in the ICS chamber:
Flow resistance through the base valve is a function of the port geometry, shim stack stiffness, fluid viscosity and damper rod velocity. The central focus of ReStackor is calculation of pressure drops across suspension valves, this allows the pressure in the compression chamber to be determined through the simple definition:
and pressures in the rebound chamber through the definition:
These two simple relationships define the rebound chamber pressure as a function of the reservoir pressure, shim stack stiffness and suspension velocity. When the pressure in the rebound chamber falls below the vapor pressure of the suspension fluid the chamber will cavitate. For the example above this occurs at suspension velocities above 85 inches/sec.
![]()
Start of Cavitation, point 1
An ICS chambered fork produces zero pressurization of the reservoir at the top of the suspension stroke. This results in a shock that is very easily cavitated at the top of the stroke. The velocity where cavitation initiates is easy to determine with ReStackor. The outputs below from the restackor-midvalve.xls spreadsheet plot the shock chamber pressures as a function of suspension position and suspension velocity. The left hand figure shows the continuously decreasing rebound chamber pressure with increasing suspension velocity due to the mid-valve pressure drop. The rebound chamber will cavitate when the pressure falls to the vapor pressure of the hydraulic fluid. For this example that occurs at a suspension velocity of 85 in/sec. The right hand figure shows the size of the cavitation bubble. At a stroke depth of 5 inches, point 5, the ICS backpressure completes filling of the cavitation bubble.
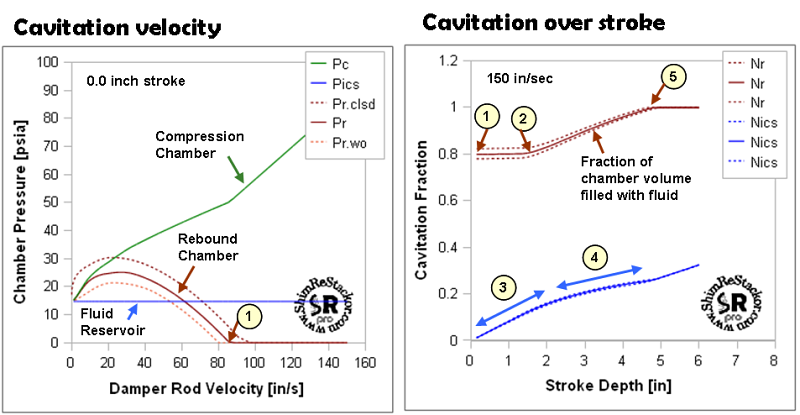
Cavitation limits are easily determined from ReStackor outputs. Numbers in the figures mark events that occur over the coarse of a suspension stroke.
The fluid volume balance in ReStackor tracks the fluid volume in the rebound chamber and reports the fraction of the chamber volume filled with fluid, Nr. Under non-cavitating conditions the chamber is completely filled with fluid and Nr=1. When cavitating the value of Nr falls below one. For the conditions of the sample calculation Nr=0.8 at the top of the stroke leaving 20% of the chamber volume filled with the cavitation bubble over the first two inches of the suspension stroke. As the ICS system builds pressure deeper in the stroke the value of Nr increases and reaches 1.0 at a stroke depth of five inches marking the end of cavitation.
When the rebound chamber is cavitated the initial portion of the rebound stroke produces no damping while the cavitation bubble collapses. Beyond loss of damping, the suction force of the collapsing cavitation bubble adds to the spring force of the suspension causing the shock to pop back to the top of the stroke. This creates the feature of "riding high in the stroke". This same feature can also pop you off the outside of a turn when trying to hold the front end down on a turn entrance. Whether cavitation is a feature or a snake-bite suspension behavior depends on how your fork is tuned. The ReStackor Nr parameter tells you the severity of cavitation as a function of stroke depth and (1-Nr) and the fraction of rebound stroke lost while the cavitation bubble collapses.
Deeper in the stroke the backpressure produced by the ICS system suppress cavitation. The effect of stroke depth on cavitation is easy to determine with ReStackor. Running the calculations at a stroke depth of six inches shows the fork will not cavitate below suspension velocities of 160 in/sec.
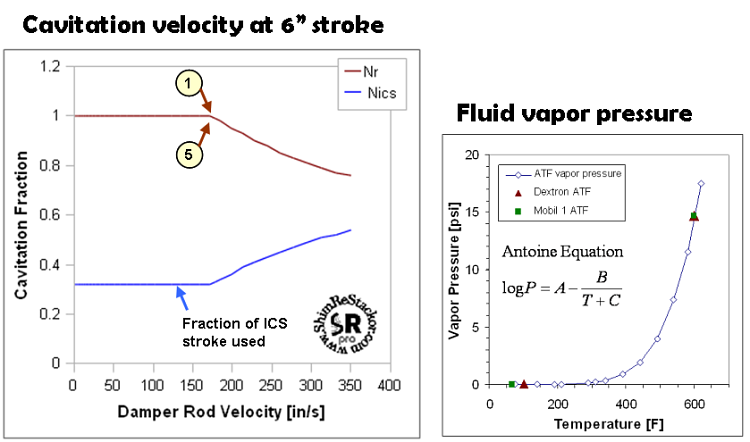
At a six inch stroke depth a suspension velocity greater than 160 in/sec is needed to cavitate the rebound chamber.
ReStackor uses the Antoine vapor pressure equation to determine the effect of temperature on vapor pressure and the Andrade equation to determine the effect of fluid temperature on viscosity. This allows you to evaluate the relationship of reduced viscosity and valve pressure drop as fluid temperatures increase against the effect of higher fluid temperatures on fluid vapor pressure and cavitation limits. For the practical range of fluid temperatures the fluid vapor pressures computed by ReStackor will be near zero pressure.
![]()
End of ICS Spring Float, point 2
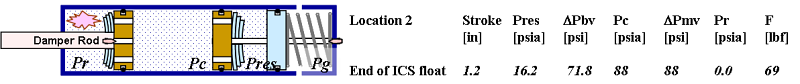
Before engagement in the ICS spring there is a gentle rise in pressure in the fluid reservoir due to compression of the gas trapped behind the ICS piston for a closed chamber configuration or compression of the gas in the fork for an open chamber ICS configuration. ReStackor models both. This gentle rise in pressure can be seen in the ReStackor chamber pressure plot from point 1 to point 2.
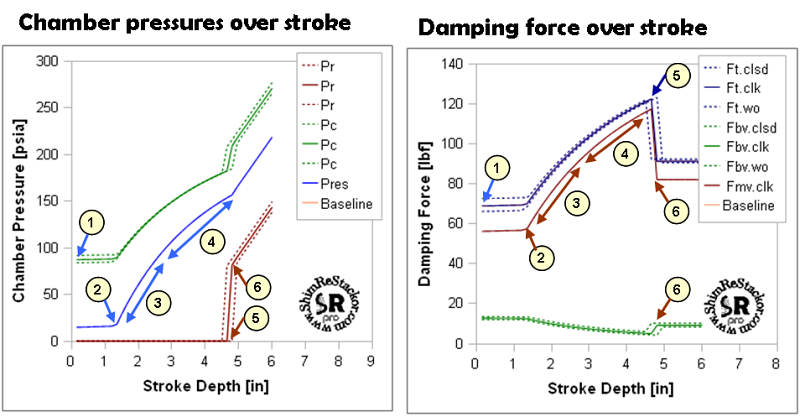
Chamber pressures and damping force calculations of ReStackor show the effect of mid-valve cavitation over the coarse of the suspension stroke.
At point 2 engagement of the ICS spring causes pressures to rapidly rise in the fluid reservoir (Pres) and the shock compression chamber (Pc).
![]()
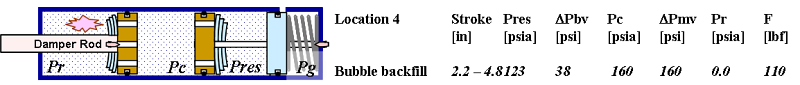
Bubble Growth, point 3
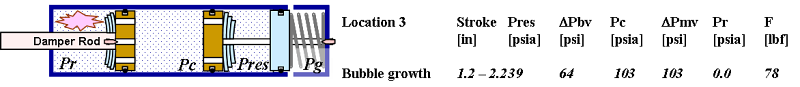
When the rebound chamber is cavitated the pressure in the shock compression chamber (Pc) is insufficient to force the mid-valve flow needed to keep the rebound chamber filled with fluid. The deficit in flow results in the formation of a vacuum cavitation bubble in the rebound chamber. The severity of cavitation is reported by the ReStackor parameter Nr as the fraction of the rebound chamber volume filled with fluid. The volume of the cavitation bubble can be estimated through the definition:
The severity of cavitation and the cavitation bubble volume is computed by ReStackor
The high rate of bubble growth in the initial stage of cavitation can be clearly seen in the cavitation bubble volume plot from point 1 to point 2. As the ICS system builds pressure the rate of bubble growth decreases and reaches the maximum volume approximately 2.5 inches into the stroke. At this location the ICS system has built sufficient backpressure to stop growth of the cavitation bubble.
As the suspension advances beyond the 2.5 inch location further increase in pressure from the ICS system begins to force additional flow through the mid-valve and backfill the cavitation bubble. In region 4 the high backpressure produced by the ICS system acting against the near vacuum pressure of the cavitation bubble cause a damping spike. That damping spike is caused by the higher fluid flow rates and pressure drop across the mid-valve during the bubble filling process.
![]()
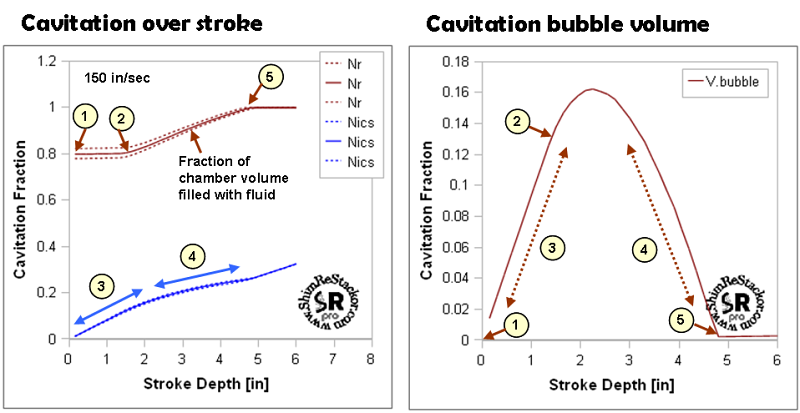
Bubble Backfill, point 4
When cavitated, excess fluid that cannot pass through the mid-valve is force out through the base valve. This cavitation driven flow surge through the base valve into the fluid reservoir increases the fluid volume in the reservoir and the back pressure produced by the ICS system. Increased flow through the base valve increases the pressure drop across the base valve and pressures in the shock compression chamber. The elevated pressure forces more flow through the mid-valve partially healing the cavitating mid-valve flow. These effects are fully modeled by ReStackor and each of these effects can be observed in the chamber pressure profile over the stroke.
The cavitation driven flow surge into the fluid reservoir results in an increase rate of pressure rise over range 3. In range 4 the the back pressure produced by the ICS system forces more flow through the mid-valve to begin the process of closing out the cavitation bubble. While the bubble is filling, the higher flow rate through the mid-valve results in less flow through the base valve. The lower base valve flow results in a decreased damping force from the base valve as can be seen in the right hand figure. Lower flow through the base valve also results in a lower fluid flow rate into the shock reservoir and a decreased rate of pressure rise from the ICS system.
In region 4 the higher fluid flow rates through the mid-valve during the cavitation bubble filling process result in elevated damping forces. After collapses of the cavitation bubble, point 6, damping forces drop to the normal value produced under non-cavitating conditions. The jump in damping force can be seen in both the mid-valve and base valve damping force curves. The mid-valve damping force jumps down due to the decreased mid-valve fluid flow at completion of cavitation bubble filling. When the fluid backflow through the mid-valve stops at collapse of the cavitation bubble the flow rate through the base valve increases causing the base valve damping force to jump up slightly at point 6.
Mid-valve cavitation initially produces a flow surge into the fluid reservoir. As backpressure from the ICS system increases more flow is forced through the mid-valve to backfill the cavitation bubble. These same effects of the cavitation driven flow surge can be observed in movement of the chamber separation plate in the Roehrig video demonstrating cavitation effects in a shock. This entire process is modeled in ReStackor calculations.
![]()
End of Cavitation, point 5 and 6
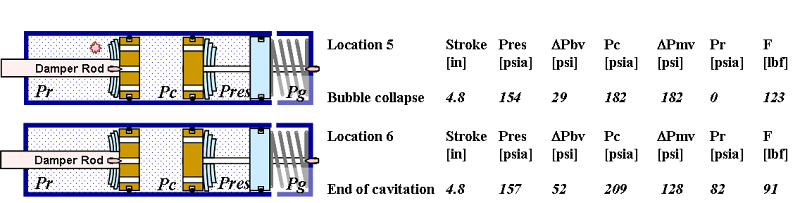
When the rebound chamber is cavitated pressures in the entire chamber are dictated by the vapor pressure of the hydraulic fluid. Attempting to operate the suspension at velocities beyond the cavitation point simply results in the flashing of more fluid and the formation of a larger cavitation bubble. Similarly, if the damper rod motion were stopped the chamber pressures would remain fixed at the fluid vapor pressure until enough fluid has been transferred through the mid-valve to completely fill the cavitation bubble. As long as the cavitation bubble is present pressures in the cavitating chamber remain fixed at the vapor pressure of the hydraulic fluid.
When the cavitation bubble collapses pressures in the rebound chamber jump from the cavitation condition to the near incompressible ridged flow condition dictated by the hydraulic pressure drop of the mid-valve. For the sample case here that pressure jump is from near vacuum conditions to a pressure of 82 psi in the rebound chamber between points 5 and 6.
The jump in chamber pressure pressurizes the back side of the mid-valve and results in a damping force jump. During cavitation, point 5, the 182 psi pressure drop across the mid-valve produces a damping force of 123 lbf. After collapse of the cavitation bubble, point 6, the pressure in the rebound chamber jumps to 82 psi dictated by the rigid conditions of non-cavitating hydraulic flow and the damping force decreases to 91 lbf.
At the near vacuum conditions where cavitation occurs the heat of vaporization of hydraulic fluid is small. The low energies involved in the phase change allows the fluid to snap from cavitating to non-cavitating conditions almost instantly. This is demonstrated in the Roehrig video.
It is important to recognize the binary nature of cavitation. While the cavitation bubble is present pressures in the rebound chamber are dictated by the vapor pressure of the hydraulic fluid. This is a near zero pressure at practical fluid temperatures. Upon collapse, pressure jump to the ridged non-cavitating conditions dictated by the hydraulic pressure drop of the mid-valve. There is no intermediate state, the vapor bubble is either present or not. The instantaneous jump in pressure produces a jump in damping force and that jump effects the damping force delivered by the shock whether the suspension is in the compression or rebound stroke.
![]()
Suspension Velocity Effects On Damping Force
When the suspension flips from cavitating to non-cavitating flow a jump in damping force occurs. When cavitated, pressures produced by the ICS system act against the near vacuum pressures of the cavitation bubble producing a high damping force. At collapse of the cavitation bubble, the high pressures of the ICS system pressurize the back face of the mid-valve and produce no net effect on damping force. The large changes in fluid reservoir pressures produced by an ICS chambered fork result in large changes in damping force depending on stroke depth and suspension velocity.
In the ReStackor damping force velocity plot the jump in damping force when the suspension is driven beyond the cavitation limit is caused by the reverse transition from point 6 to point 5.
Damping force produced by an ICS chambered fork is a strong function of stroke depth and suspension velocity.
Cavitation Damping Force Jump
At point 6 the suspension is operating below the cavitation limit in the normal non-cavitating mode. Here the pressure on the back side of the mid-valve is dictated by the hydraulic pressure drop of the mid-valve and the damping force is a direct function of the pressure drop. Under non-cavitation conditions the high backpressures produced by the ICS system are irrelevant in computing the damping force. The pressures produced by the ICS system only act on the small area of the damper rod effecting the overall spring force. This force is present during both the compression and rebound stroke making it a spring force.
When the suspension transitions from point 6 to point 5 the mid-valve cavitates. When cavitated pressures on the back side of the mid-valve are dictated by the fluid vapor pressure and the pressures on the front side of the valve are dictated by the high back pressures of the ICS system. High pressures produced by stiff ICS springs act on the front side of the valve and cavitation dictates near vacuum pressures on the back side of the valve. This high pressure drop acts directly on the damper rod and produces the jump in damping force when the suspension transitions from non-cavitating to cavitating flow (point 6 to point 5). If the suspension were to freeze at point 5 the high flow rates through the mid-valve would fill the cavitation bubble very quickly.
When evaluated damping force over the stroke depth (the frame above in this tread) the transition from cavitating conditions a point 5 to the non-cavitating conditions at point 6 cause a damping force drop. When evaluating damping force as a function of suspension velocity the reverse transition from non-cavitating to cavitating conditions at a higher velocity causes a damping force increase. The reasons are the same, the process is simply reversed.
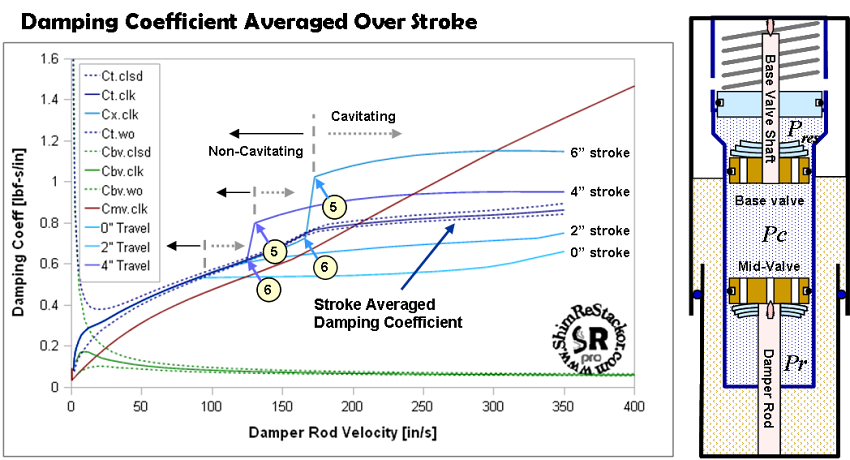
Stroke Averaged Damping Force
Due to the large change in damping force produced by ICS systems over the stroke depth an averaged damping force is needed for tuning purposes. ReStackor computes the average damping force by integrating the damping force over the stroke depth to determine the stroke average damping force. The stroke average damping force is computed by integrating 240 steps over the stroke depth at each suspension velocity. The averaged damping force is reported in the ReStackor outputs as Ct.clsd, Ct.clk and Ct.wo. These are the stroke averaged damping force values with the base valve compression clickers in the closed, requested and wide opened positions. The ReStackor parameter Cx.clk is the damping force produced at the requested stroke depth with the clickers set at the requested position. As shown above cavitation can cause a large difference between the damping force produced at a specific stroke depth and the average damping force over the stroke.
ICS Spring Force
The pressure forces produced by an ICS system acting on the area of the damper rod are present under both the compression and rebound stroke. The ICS force produced is a spring force not a damping force. Since ReStackor is focused on the calculation of damping forces the calculations only report the damping force and do not include the spring force of an ICS system. For this reason a 1.2 kg/mm ICS spring will produce exactly the same damping force as a 2.1 kg/mm spring when the suspension is operated under non-cavitating conditions.
